
What is climate change?
What exactly is climate change? If you were asked, could you explain the concept? Most people have heard of climate change but struggle to see how it impacts their daily lives or are so overwhelmed with information that they find it hard to see how to actually make a difference.
How many people, if asked, could actually tell you what climate change is? Most people have heard about climate change but struggle to see how it affects their daily lives or are so overwhelmed with information that find it hard to see how they can actually make a difference. On the Redmap site you will read information about future projections and scenarios of the effects of climate change on our marine environments.
Redmap provides an opportunity to contribute to climate change research and play a part in developing a greater understanding of the effects of climate change on Australia's marine environment. But what exactly is climate change?
The earth’s atmosphere
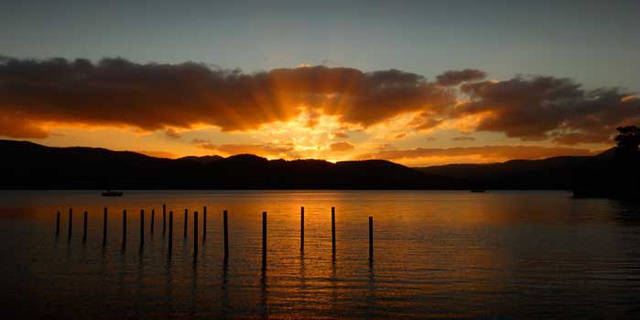
Have you ever climbed into a car on a sunny day and noticed how warm it is inside? This is because the glass windows have trapped the warmth of the sun’s radiation. This is much like how a garden greenhouse works and is the reason the warming of the earth is called the ‘greenhouse effect’.
The atmosphere surrounding the earth can be compared with the glass windows of your car or a greenhouse. It comprises a variety of gases that reflect some of the sun’s radiation but also trap heat. The greenhouse effect is a neat way to describe how the atmosphere of the earth plays a role in modifying the earth’s temperature.
The greenhouse effect and global warming
Greenhouse gases and the greenhouse effect are naturally occurring phenomena. The earth’s climate is not static and has been undergoing changes in greenhouse gas concentration for millennia, evidenced by ice cores and geological data collected by scientists.
However, there is current evidence to suggest that as a result of human (anthropogenic) activities, the proportion of greenhouse gases are increasing. This is often referred to as the enhanced greenhouse effect (although being enhanced in this case is not a good thing).
The significant increase in greenhouse gases is resulting in greater absorption of the sun’s radiation, trapping heat and increasing the natural greenhouse effect of the atmosphere. The result of extra heat in the atmosphere is increasing the temperature of the earth’s surface (and troposphere), resulting in global climate change or global warming.
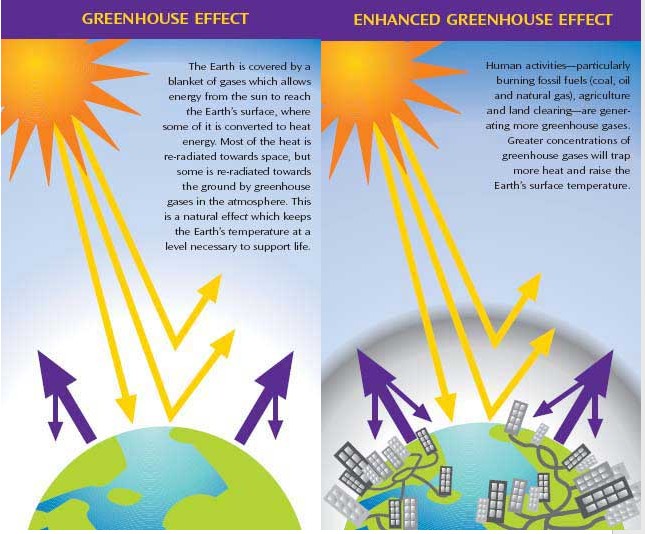
Natural greenhouse effect and a depiction of increased greenhouse gasses in the atmosphere as a result of human activities (image: Australian Government White Paper Frequently Asked Questions)
There are a number of greenhouse gases including methane, nitrous oxide, water vapour and carbon monoxide among others. However, it is usual to talk about climate change contamination or pollution in terms of carbon dioxide (CO2) levels. Carbon dioxide levels have been steadily rising over the last 300 years, coinciding with the huge increase in burning carbon-based fuels, or fossil fuels, since the beginning of the industrial revolution. Current CO2 levels exceed 380 parts per million, whereas pre-industrial levels were 280 parts per million. These levels are measured in Hawaii at the Mauna Loa Observatory. See the most current CO2 data at http://co2now.org
Models and projections
If I want to know what will happen in my future I would make a prediction, based on the best available information I had, although it would be very difficult to get an exact answer and I would probably just have to wait like everyone else! When it comes to climate change, scientists use computer-based simulation models to develop projections of what might happen into the future. It is not really all that easy to create a climate change scenario that accurately reflects what lies ahead as there are many factors that need to be taken into account including human population, major fuel sources i.e. coal versus renewable, deforestation and many more.
There is a lot of time and energy put into creating scenarios that represent future global conditions. It is very important as people need to be prepared to adapt to changing conditions and will also need to manage resources appropriately in order to reduce CO2 emissions. Much of the climate change science available to us currently has been developed by thousands of scientists across the globe who contribute to the research and reports of the Intergovenmental Panel on Climate Change (IPCC). The IPCC have developed many models and predictions relating to climate change, describing climate models, or general circulation models (GCM) as:
‘A numerical representation of the climate system based on the physical, chemical and biological properties of its components, their interactions and feedback processes, and accounting for all or some of its known properties. The climate system can be represented by models of varying complexity, that is, for any one component or combination of components a spectrum or hierarchy of models can be identified, differing in such aspects as the number of spatial dimensions, the extent to which physical, chemical or biological processes are explicitly represented, or the level at which empirical parametrisations are involved.’ (IPCC 2007)
Sounds complicated doesn’t it? It is! GCMs use maths and physics equations to represent changes in the atmosphere and oceans and these equations are then manipulated to project forward into the future.
 The models are run over a large time period, and with differing concentrations of greenhouse gases, ranging from ’high’ to ‘low’ emission scenarios. Scenarios are often presented for the future assuming different levels of carbon pollution in the atmosphere, for example surmising that we cut carbon emissions (low scenario), keep polluting at the same rate (medium scenario) or if we increase our greenhouse gas pollution (high scenario).
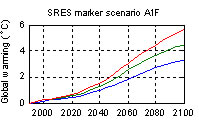
The illustration shown (image: CSIRO) is from a special report on emission scenarios (SRES) by the IPCC. This clearly shows the variation in anticipated global warming (degrees Celsius on the left of the graph) varies depending on which future carbon dioxide emissions scenario is applied to the models. The three lines on each panel represent low future emissions (blue), medium future emissions (green) and high future emissions (red).
The IPCC projections are presented on a global or regional scale; however, this is not always accurate when you are considering a relatively small area such as the Tasmanian coast with its own localised weather patterns and climatic conditions. Luckily, recent work by the CSIRO has provided a more detailed example of climate change scenarios in the southern regions of the world, including Tasmania, using the CSIRO Mk 3 Climate Model.
Source Information:
Federal Government Department of Climate Change all the latest information about Climate change in Australia http://www.climatechange.gov.au and an explanation about What is Climate Change? http://www.climatechange.gov.au/climate-change/science/greenhouse-effect.aspx
CSIRO website Climate Change page http://www.dar.csiro.au/information/climatechange.html
CO2 Now up to date measurements of CO2 levels in our atmosphere http://co2now.org
IPCC (2007) Climate change 2007: impacts, adaptation, and vulnerability. Working group II contribution to the intergovernmental panel on climate change fourth assessment report. IPCC Secretariat, Geneva.http://www.ipcc.ch/publications_and_data/publications_ipcc_fourth_assessment_report_synthesis_report.htm
IPCC Special Report on Emissions Scenarios http://www.grida.no/publications/other/ipcc_sr/?src=/climate/ipcc/emission/
Pecl G, Frusher S, Gardner C, Haward M, Hobday A, Jennings S, Nursey-Bray M, Punt A, Revill H, van Putten I (2009). East coast, Tasmania – an assessment of climate change impacts on east coast rock lobster productivity, interactions with fisheries management andflow-on effects to local communities. Case study to support a ‘first pass’ National ClimateChange Coastal Vulnerability Assessment (NCVA). Report to the Department of ClimateChange, Australia. April 2009. http://www.climatechange.gov.au/sites/climatechange/files/documents/03_2013/rock-lobser-report.pdf


