The Redmap Australia Decadal Report Card
Redmap Team.
Download our Australia-wide Report Card poster and 4-page state report cards to learn what species Australia's fishers and divers have spotted on the move over the past decade.
The products:
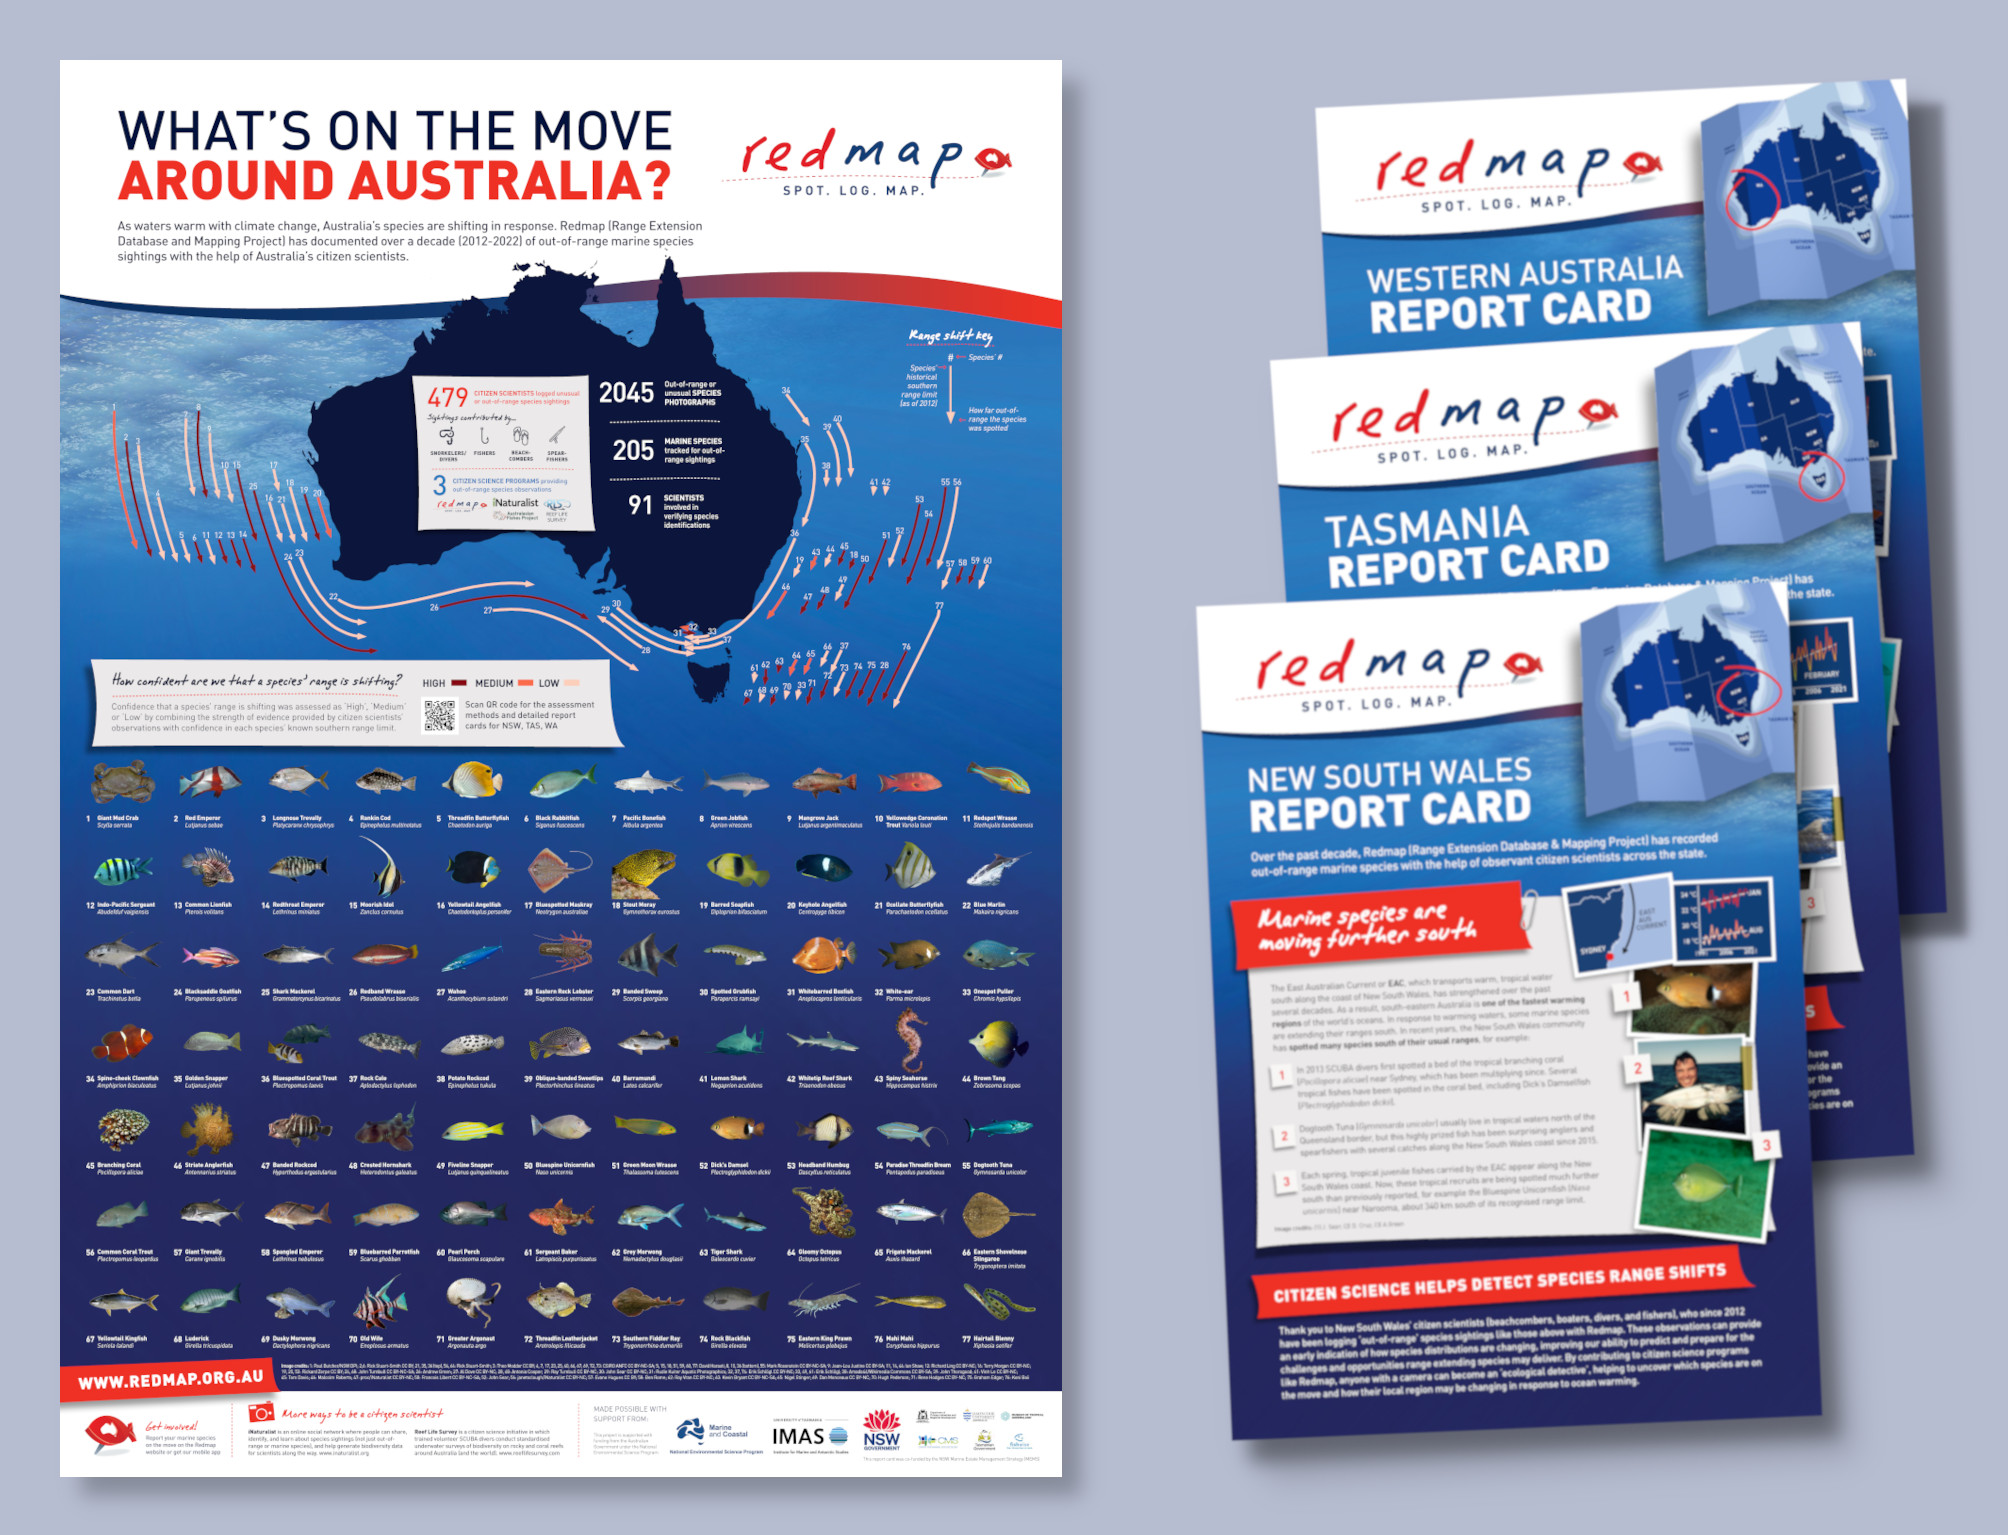
The Redmap Australia Report Card Poster (pdf)
The poster can be printed from paper sizes A3 to A0, but is best at A1.
Four-page centre-fold state report cards:
For information about our assessment methodology, results, and development of these report cards see the summary below or find the technical details here: Redmap report card project final report DRAFT (pdf)
What we did
The super short version:
To assess the evidence available regarding range extensions of marine species around the Australian coastline we collated observations from Australian citizen science programs, undertook extensive quality control and verification of the data collated, determined historical poleward range limits of the relevant species and then examined evidence for recent range extensions beyond those range limits using a methodology modified from Robinson et al. 2015.
The slightly longer version:
This project developed state-based (WA, NSW and Tas) and national report cards assessing Australian marine species to determine species that have potentially undergone recent changes in distribution, extending their southern range limit into new areas as our oceans warm. These report cards draw upon several national citizen science databases and use a robust decision tree analysis to outline which species are shifting, and with what degree of certainty.Briefly, the assessment produces estimates of overall confidence in potential range extension by combining classifications of confidence in A) a species historical distribution limits at a given time point and B) evidence of observations of post-recruits further south of the poleward historical range limit, provided by citizen science observation data.
Project objectives were to 1. draw upon the existing knowledge of marine citizen scientists to identify climate‐driven changes within the Australian marine estate; and 2. develop products to communicate to and engage with the public on issues of climate change and biodiversity using their own citizen science information.
This project collated and assessed out-of-range observations from:
- The Redmap (Range Extension Database and Mapping Project) Australia project, a national initiative since 2012 that invites fishers and divers to submit photographic observations specifically of out-of-range species with the explicit aim of identifying potential range extending species. https://www.redmap.org.au/
- The iNaturalist Australasian Fishes project, which invites marine users to send in photographs of any marine species, regardless of location, and has amassed over 180,000 observations as of August 2022 (many designated as ‘research grade’ with a community consensus on a precise identification) that are yet to be analysed for potential range shifting species. https://inaturalist.ala.org.au/projects/australasian-fishes
- Reef Life Survey, a program which undertakes structured systematic surveys of inshore reefs with trained volunteer SCUBA divers, providing a rich database of species occurrences through time that is used to assess a variety of biogeographic questions. https://reeflifesurvey.com/
Using the Redmap Australia species list as a basis, 200 target species were included in this assessment. Geographic distribution limits for these species were established as of 2012 to define the historical southern boundary limit against which to compare subsequent out-of-range observations recorded between 2013 and 2021. After filtering the citizen science database extracts for target species and verification, the final species occurrence dataset included over 76,000 non-duplicate out-of-range observations, representing 197 of the 200 target species. Of the target species considered for the assessment, 77 were represented in the databases with observations with photographic evidence beyond the established historical distribution limits.
82 potential regional range extensions were assessed in total as some of the 77 species had observed out-of-range observations on either both the west and east coasts, or both southward in Tasmania and west on the south coast. Relatively even numbers of range extensions were assessed in Western Australia, New South Wales, and Tasmania with smaller numbers in Queensland, Victoria and South Australia. Western Australia, New South Wales and Tasmania all had sufficient range extensions determined to warrant state-specific report cards and all shifts were then reported in the national poster summarising all changes in distribution.
The target list of species assessed included a wide range of taxonomic groups, including anemones, corals, crabs, lobsters, seastars, urchins, sharks, rays, dolphins, morays, octopus and many different teleost fish. In total, 31 range extensions were classified with high confidence, eight with medium confidence, and 43 with low confidence. The mean extent of range extensions assessed, calculated as latitudinal distance (or longitudinal distance on the south coast), from historical distribution limit to the maximum extent of recent citizen science observations or was 316 km, with a maximum of 1474 km. The eight extensions with the greatest poleward extent all occurred from the Leeuwin current-influenced west.
Engagement from citizen scientists, marine managers and other marine stakeholders throughout both the development of the assessment process and the design and review of the report cards was extremely high. The report cards have been widely disseminated so far and have been very positively received. Over the next year the final products will be used by the citizen science programs involved, host and supporting institutes, coastal councils, and local and state-based fishing, diving, marine tourism and conservation groups to engage people on issues related to climate change and biodiversity generally, and the climate-driven redistribution of life specifically. The national report card was designed as a visually appealing poster that can be readable from A3 format (ie the size a standard office printer could print colour copies) but also high resolution enough to maintain quality at A0. Through extensive online networking and social media, we hope that the poster will be widely distributed, printed and displayed on office walls and halls around Australia.
We had lots of help - Thank you!
This work was undertaken for the Marine and Coastal Hub, a collaborative partnership supported through funding from the Australian Government’s National Environmental Science Program (NESP). The NSW component was also supported by the NSW Marine Estate Management Strategy.
We acknowledge the hundreds of citizen scientists of Australia – recreational fishers, SCUBA divers, beach combers, snorkellers, boaters, spear fishers and marine naturalists – that generously contribute their time and knowledge to help document important changes around the coastline. Likewise, almost 100 scientists from 30+ institutions across Australia kindly provide their expertise and time to verify observations submitted. Citizen science projects typically operate on lower levels of funding and survive through substantial in-kind support. Redmap Australia, Reef Life Survey and iNaturalist for example, also receive substantial help from a wide range of other contributors and volunteers which we would also like to acknowledge.
Many scientists, managers and science communicators provided essential input into the development of the assessment methodology and the presentation of results in report card formats. These included staff from NSW DPI, NRE Tasmania, DPIRD WA, dive and fishing club representatives, iNaturalist Australasian Fishes, Reef Life Survey, University of Tasmania, Newcastle University, James Cook University, Tasmanian Climate Change Office, Museum of North Queensland, and the Australian Museum.
Many citizen scientist observers also provided feedback on the design of the report cards, and we are grateful for their thoughtful improvements on the way we presented their data. Lastly, ecological monitoring often requires information over extended periods of time and so we would like to acknowledge the previous funders of the citizen science programs providing data used in this assessment.


