
Measuring marine range shifts
Dr Christopher J. Brown.
There are many ways to measure range shifts. Each way has its own pros and cons. Statistics help scientists find the most appropriate way to measure range shifts.
-

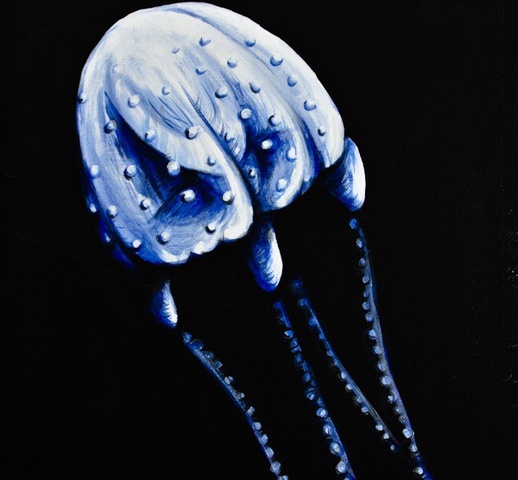
Irukandji jellyfish. Credit: Beth Josey, http://www.bethjosey.com.au/portfolio/irukandji-2011/
-
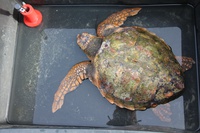
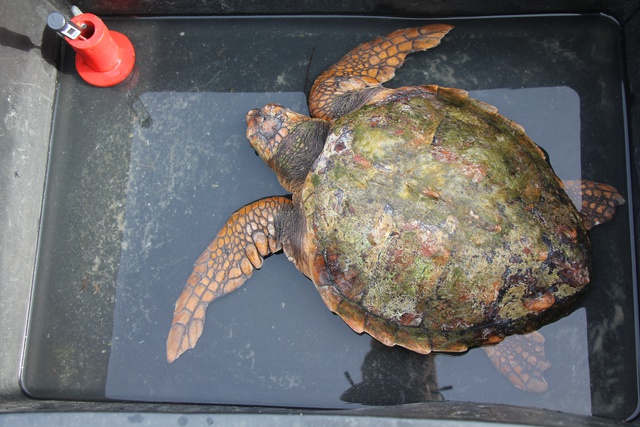
An injured loggerhead turtle sighted in Tasmania (rescued and released once recovered). http://www.redmap.org.au/sightings/1003/ Credit: Tasmania DPIPWE
-
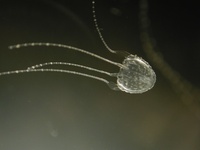
Irukandji jellyfish. Credit: Jaimie Seymour, jamie.seymour@jcu.edu.au http://www.marinestingers.com.au/stingers/Irukandji.cfm
-
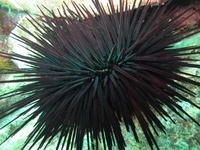
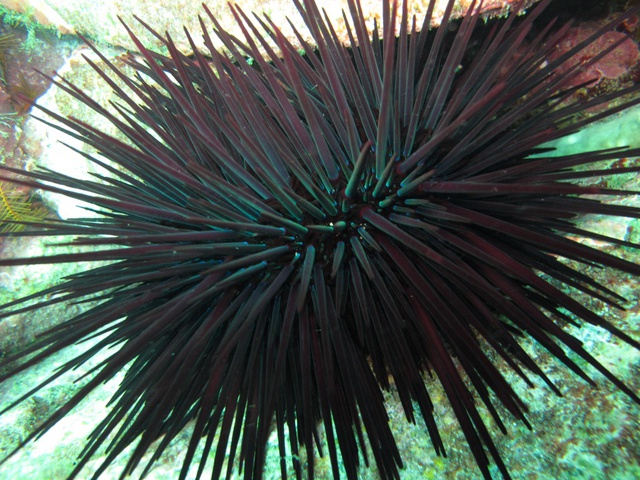
Range extending Longspine sea urchin, Centrostephanus rodgersii (Credit J. Stuart-Smith)

One of the most obvious aspects of ecology is that species have limited ranges of occurrence (with the exception perhaps of humans). Ranges are limited by many factors. A primary limiting factor is temperature. Some species, such as marine turtles, occur only in regions with warm waters. Other species, such as ice fish, occur only in the chilly waters of the Antarctic. In fact, species are adapted to specific temperature ranges. Turtles cannot survive long in cold waters and ice fish die quickly in warm water. Individuals will actively seek out their preferred temperatures.
Range shifts are one of the most obvious effects of global warming on marine species. Species ranges are generally expected to shift towards the poles, as species follow their preferred temperature range. However, not all species are expected to respond in the same way. Some species may have broader temperature tolerances than others, so their range shifts may be slower. Explaining these differences is an important question for the science of ecology and for understanding the economic implications of range shifts.
While pole-wards range shifts make sense intuitively, they are much harder to demonstrate in the wild. Scientists cannot observe every marine organism all of the time so they need to decide how best they can plan research surveys to improve our knowledge of range shifts.
There are many ways to measure a species’ range. Each type of measurement has its own pros and cons. You could measure the southern most point a species has been sighted. You could then see if that southern point is moving further south (or north) over time. You could also survey to find out the temperature range a species occurs in and see if it follows this range with warming. If you had even more time, you could also count the abundance (i.e. the number of individuals) of the species across its entire range and identify where it is most abundant. A species’ abundance should also move toward the poles, if the species is responding to warming waters.
A species’ southern most point is a very sensitive measure of range. Imagine if a single turtle was seen in southern Tasmania! This would imply a very large range shift. Whereas, measurements of abundance across a range are a much more conservative way to look for the effects of global warming. It would take many individuals moving south to detect a range change.
Scientists use statistics to build a picture of range shifts and identify the influence of global warming. Statistics can separate natural short-term changes in ranges from the long-term pole-wards shifts expected to be caused by climate change. Statistics can also be used to account for patchy observations. Importantly, statistics can give scientists an idea of how confident they are that a species is changing its range.
Ultimately, the decision about how to measure a range shift will depend on why you care about range shifts and the resources available to measure them. Counting abundances across a range shift is much more conservative than single observations, but also much more expensive. Therefore, single observations (like those collected by Redmap) may be a more effective way to get an idea of range shifts for a large number of species. Further, If the consequences of a range-shift are large, such as deadly jellyfish moving south on the Australian coast, then you would want a very sensitive measure. This would involve counting abundances, or at least compiling as many observations as possible across the range.
Based on:
Brown, Schoeman, Sydeman, Brander, Buckley, Burrows, Duarte, Moore, Pandolfi, Poloczanska, Venables, Richardson (2011). Quantitative approaches in climate change ecology. Global Change Biology, 17: 3697-3713.


