Have you ever wondered why the Redmap log it point might differ from the species distribution?
Redmap admin.
You may have noticed that for some Redmap species listed, the actual species distribution displayed on the map differs from where we are actually asking you to log the species….
-
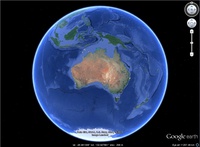
Where in the world do species live...?
-

Amelie....(aka "Gretta's kid") colouring in....this is NOT how we came up with the Redmap species distributions...
-
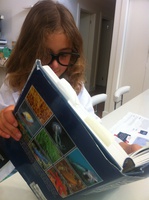
Seriously - we're just kidding - she really didn't do ANY of the species distribution work...


You may have noticed that for some species, the species distribution map differs from where we Redmap asks you to log that species:
Have we just got it wrong? Did you just assume we asked Gretta’s kids to colour in the distribution maps for us**...?
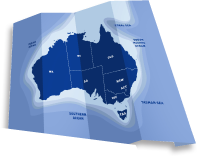
There is good reason (many, in fact!) that the Redmap log it points and distribution maps do not always match up. For example…a random Redmap species distribution map may look like this:

The first thing you need to know is that actually defining a species distribution is REALLY hard to do in the first place! And even more so in water! Not only is it hard to get information on where a species lives – but distributions often vary naturally to some degree (maybe moving with seasonal fluctuations such as water temperature…which itself may be different every year), but they are also complicated by juveniles often living in different areas to adults, or breeding adults living in different areas at different times of the year, and general lack of data! (See here for how and why citizen science is helping to bridge that data gap). So, if the log it point appears above the distribution limit – it could mean that scientists are after more information on the southern edge of the range. If the log it point is below the distribution depicted on the map – this probably means that the published references and literature cited used to determine the range and not consistent with what scientists and experienced fishers or divers actually know of the real species range.
In an attempt to be consistent across the website, Redmap have used a bunch of reference material – see here for the full list. As you can see – it’s quite a list! So the distributions Redmap presents are not generated by our data – but based on what research and information we could get our hands on. So... if you’re one of those fishers that knows snapper have been in Tassie for years….help put it on the map – help define the distribution – and log that next catch!
**Disclaimer: this information is in no way based on our knowledge of Amelie’s colouring-in skills or abilities to ‘stay within the lines’, nor makes any judgement Gretta's abilities to teach colouring in to her kids...


